What Is Today’s Data?
Overview
The Today’s Data feature allows staff to summarize and enter session totals after a session has ended. This is helpful when data was collected on paper or by another method, but can also be used to review the data you’ve already collected.
Why Use It?
· Enter totals at the end of a session
· Access graphing without live data entry
· Correct or complete data from prior sessions
Key Capabilities
· Rapid entry of session totals
· Enter data for one or multiple targets at once
· Admins/BCBAs can review and override staff entries
· Supports entering data from previous days
Access Requirements
⚠️ This feature requires special permission
· Permission must be enabled for staff who need access
· This can be found under: Manage Client → Collect Data
Quick Start (TL;DR)
1. Open client profile in the web portal
2. Go to Manage Client → Collect Data
3. Start a session
4. Open Daily Summary Data
5. Enter totals for the session
Step-by-Step Walkthrough
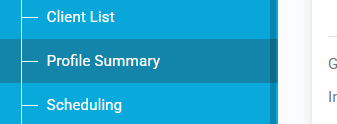
① Open the Client Profile
· Use the Client List or Search to find your client
· Open the Profile Summary
② Go to Collect Data
· From Manage Client, select Collect Data

③ Open Daily Summary Data
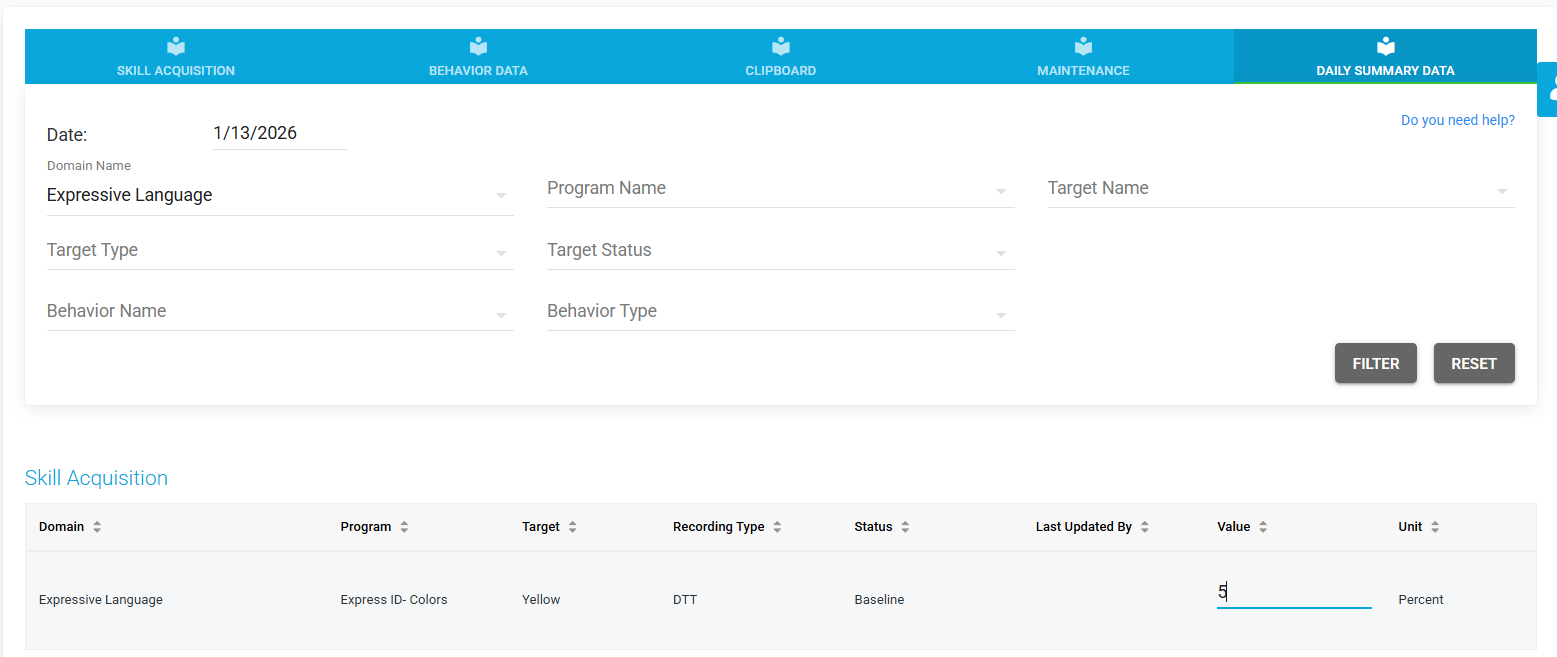
· Do not enter data in Skill Acquisition or Behavior tabs
· Navigate to Daily Summary Data instead, this tab is located on the right after the maintenance tab
④ Enter Session Totals
· Record totals for the session
· Use the dropdown menus to select the targets or behaviors you are working on, click filter then enter the values in the menu below
· If you do not see the targets or behaviors after filtering, please make sure that you have the correct domain, program, or target or behavior selected before selecting filter..
· Data will appear in:
o Session notes
o Client graphs
How Different Data Types Work
Some Targets are Percentage-Based Targets
· This Includes DTT and TA targets
· These are recorded as a percent for the entire session
Some Targets are Additive Targets (Important!)
These targets add to existing data for the same day, this includes:
· Frequency (counts)
· Duration (decimal format)
o Example: 0.5 = 30 seconds
✅ This means you should always check for existing entries before adding data
⚠️ Warnings You May See
· If data already exists, you’ll see:
⚠️ “Data has already been added to the daily summary”
This means the new entry will add to existing totals.
Viewing & Reporting Data
Supported Graphs
· Frequency Graphs (line graph)
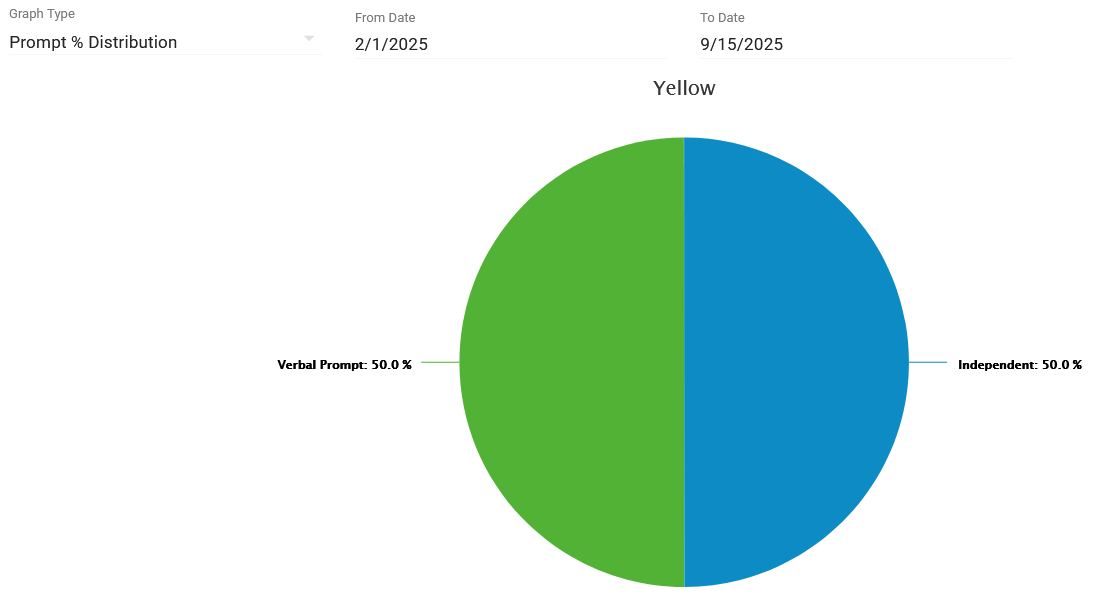
· DTT Prompt Percentage Distribution (pie chart)
Note: Trial-level graphs are unavailable for Daily Summary data
Daily Summary Report
· Exportable at the end of the session
· Useful for documentation and review
Known Limits & Notes
· Only 10 records display at a time, if you filter out more than 10 behaviors or targets make sure to use the page options to view the targets on other pages
· Rate data is not currently supported, but will be added in a future update
· Behavior data may display differently than skill data, please make note of the units when updating behavior data
Was this article helpful?
That’s Great!
Thank you for your feedback
Sorry! We couldn't be helpful
Thank you for your feedback
Feedback sent
We appreciate your effort and will try to fix the article